RadioTraffic.com 101
backDashboard
Logging In
On your desktop double click the RadioTraffic shortcut and start up the program.

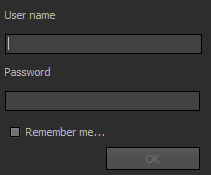
This login screen will appear.

- Enter the login that we provided to you.
- Enter the password that we provide to you.
- Click the “Remember me” checkbox (if you want to for later easer access).
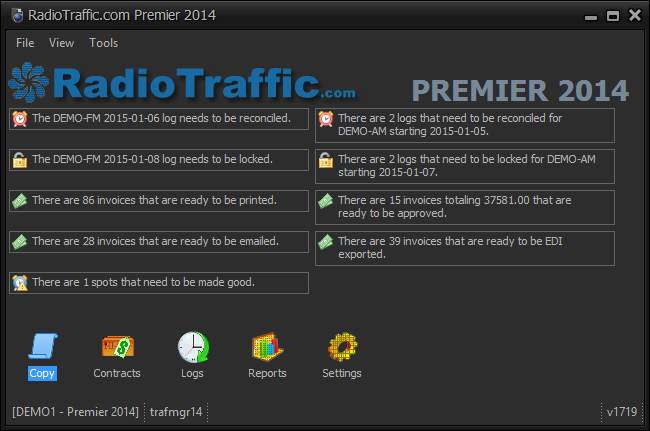
After you login with your password we provided, the main screen of RadioTraffic pops up and we call this the dashboard.

As you can see the dashboard is broken into several sections.
The menu across the top left has File, View and Tools.
Under
File you have the ability to log off or exit.
Under
View there is What’s New, Forum, and Refresh:
Under
Tools, depending on what version you have, you may see Select Skins, Reset “all” Layouts, Email Settings, etc. If you have the “Skins” Option Pack the Tools menu is where you can select which skin you have active. If you have the “My View” Option Pack you can use the Tools menu to reset all layouts which resets your My View to the factory defaults. If you have any of the option packs related to email, you will need to configure your email settings by going to Tools email settings.
Across the bottom of the main screen are several pieces of status information that may be helpful especially when you are working with support. Your group name is to the far left and next to that is your user name. At the far right is the version number of the product. Also, every once in a while you may see a little progress bar show up next to your version number. This just means a background task is taking place.
The content area of the dashboard is divided into two pieces; the Charts & Graphs section and the Module section. The Module section consists of the Administration, Orders, Logs, AR and Reports icons.
Notice that just about the logo there is a thumb up and potentially a thumb down icon. You can rate the product on a scale of 1-3 thumbs up or 1-3 thumbs down. If you are having an issue, you can right click on the thumb and a dialog box will open. Please give us a much detail as possible regarding your issue. That way we can follow up with you directly.
In the charts & graphs area, you can select which charts and graphs are displayed. Just right click on the one you want to change and then select from the drop down list which one you want to display.
At the bottom right of the charts & graphs display is a measures area that gives you a couple of pieces of information – what the current columns mean and then the current and previous values:
| Revenue Projections | This month vs last |
| Billing | This month vs last |
| Collection Percentage | This month vs prior |
| New Orders | This month vs last |
| New Customers | This month vs last |